
BECH(IDEAL) -
Interactive Data Visualization of Movie Directors
skills
WebGL, React, NYT API, RapidAPI
timeline
October — December 2021
role
Designer, Developer
Overview
This was a 2 months class project for 51-367 Computational Design Thinking taught by Professor at Carnegie Mellon. The prompt was to create an engaging web experience that organizes and displays data in a digestible approach by creating interesting patterns.
1. Data
Our group decided to showcase data related to gender representation in films. A way to measure inequality of female representation in film is the . We understand that it does not provide the perfect measure, but it provides a surface-level framework to evaluate bias against women in film.
Bechdel Test
The usual criteria of the Bechdel Test are:
- "at least two women are featured"
- "these women talk to each other"
- "they discuss something other than a man",
API: Bechdel Test, Movie Database, NYT

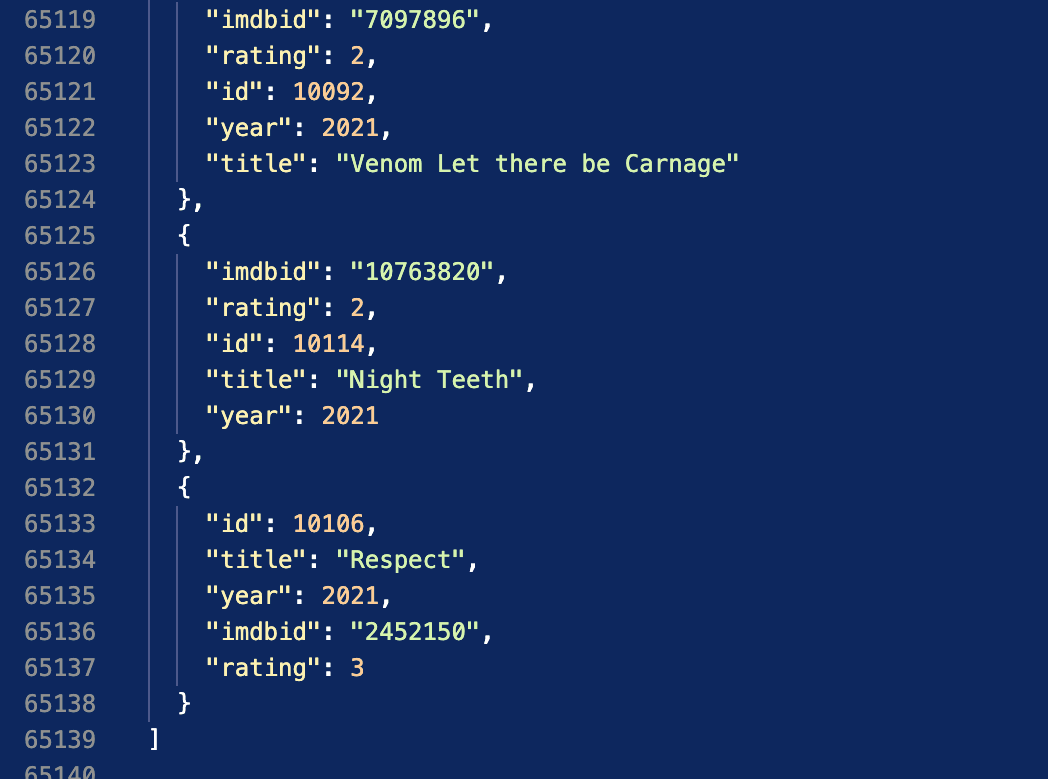
We retrieved 3508 movies from the BechdelTest API, and used this dataset as our main data. From the BechdelTestAPI, we get the IMDb id for each movie that passed the Bechdel test with a rating from 1 to 3, i.e. the number of Bechdel test rules the movie passes.
Then we ranked directors by the number of their movies appearing in the dataset from high to low, thus compiling a list of directors we want to promote and applaud for.
We decided to display directors with two or more movies passing the Bechdel Test, which leaves us with 88 directors and 305 movies to display.
We needed more data on every movie that we are displaying, therefore we used the Movie Database APIby RapidAPI.
We were able to use a movie's IMDb ID to retrieve 26 fields of data on a movie. We selected to display a movie's poster, rated, genre, awards, and box office.
Since we want to spotlight the directors, we included one more layer of data by using the NYT Developer API, in particular, the Article Search API, to find articles on the selected directors.
A challenge we encountered was that we could not programmatically search for all these directors at once as it exceeded the maximum number of calls on the API at a time. Therefore we had to do manual labour to run the script on 5 directors at a time. To do so, I created a quick interface in P5 editor that allows user to download a json containing search results, which expedited our manual process.
2. Design


We focused on designing an interactive, engaging, and fun experience that promotes and spotlights the directors by creating a unique data visualization for each director.
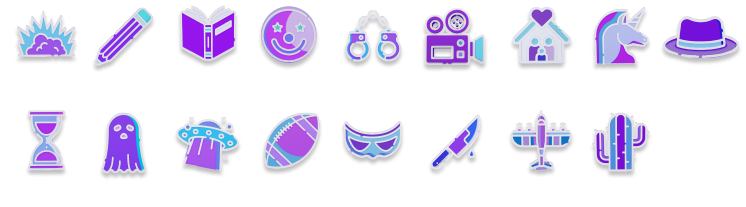
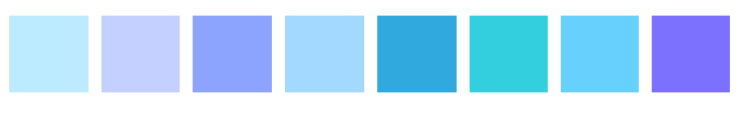
We made 3D assets for movie genres and colors for movie's content rating. These went through multiple iterations during development for visual cohesiveness.
3. Deliverable
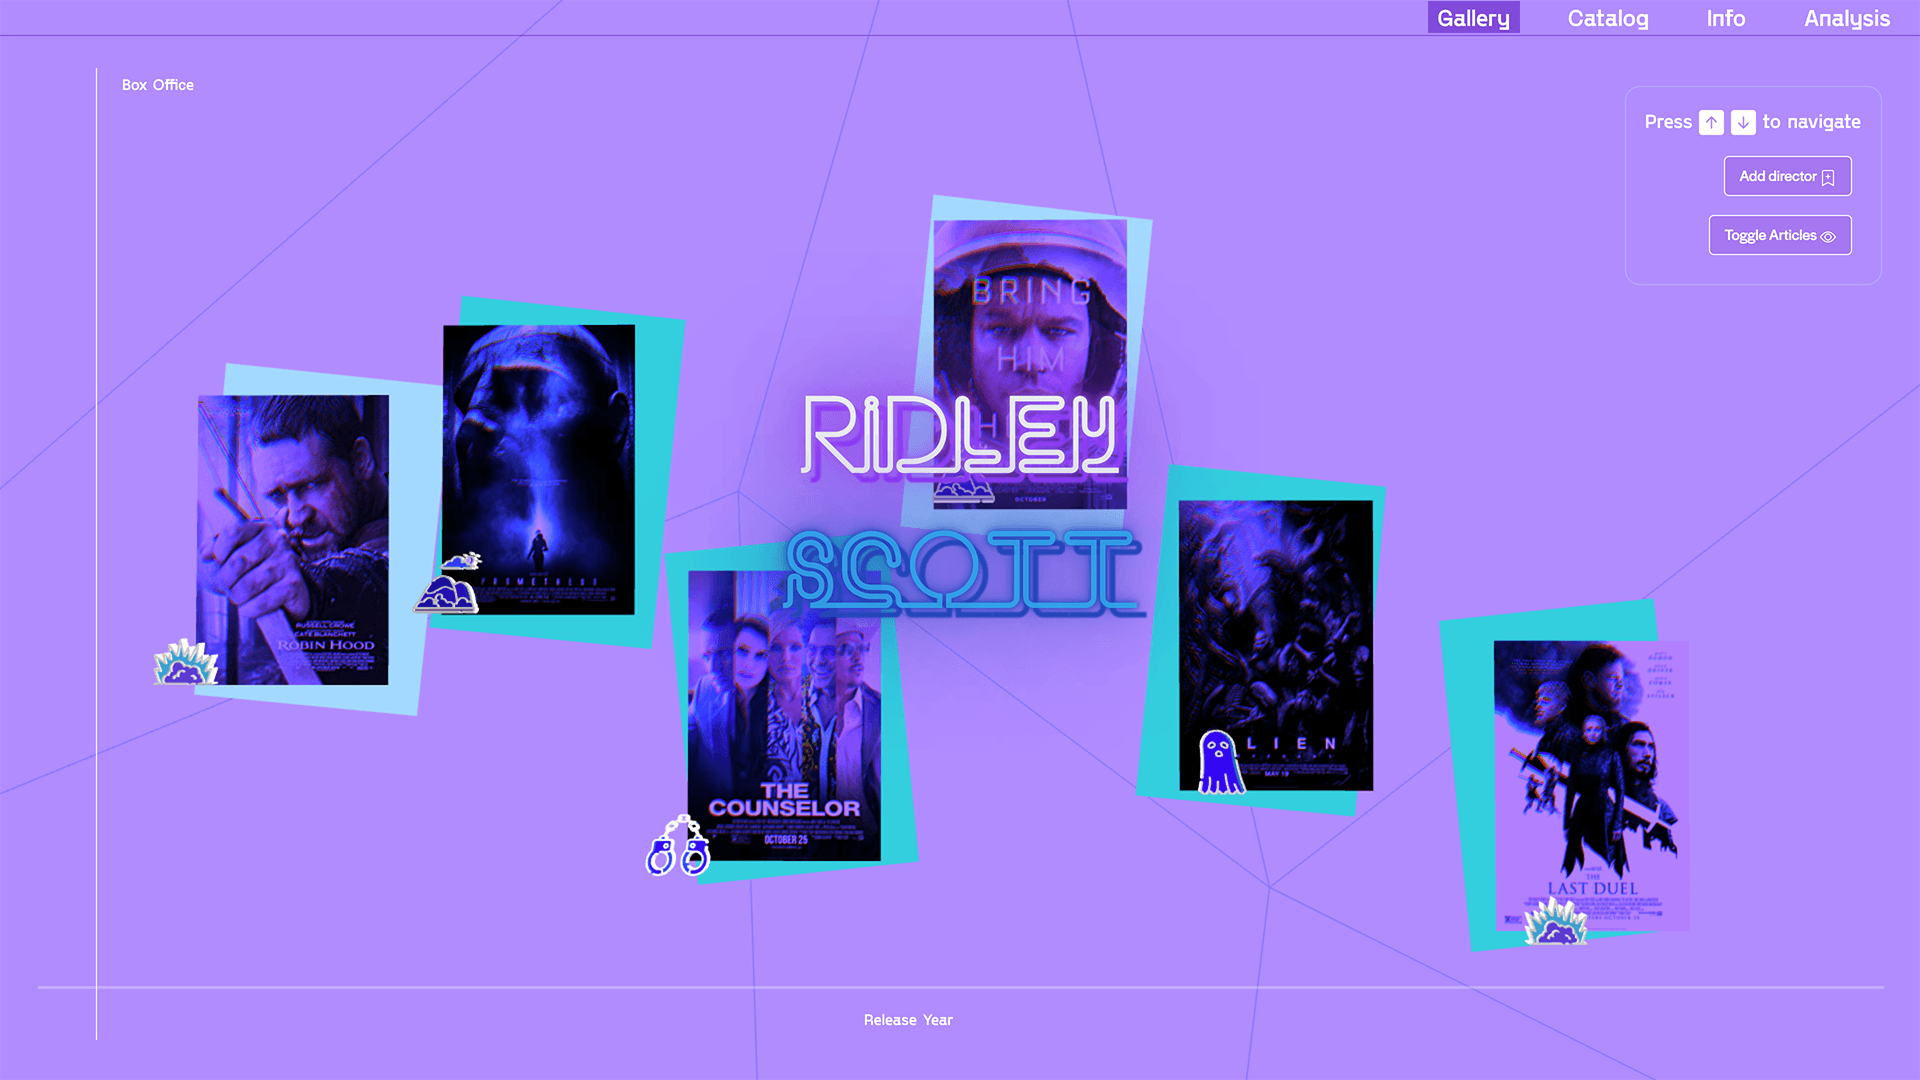
We designed the website to be a gallery the user can navigate back and forth between the directors. The directors are displayed in the order of most to least movies.
The website displays one director data visualization at a time. Each visualization plots a director's movies on a graph with two axis: box office and release date.
A design challenge we encountered was how to include the NYT articles in the data visualization, and the solution we came up with was overlaying the articles on top, and users can toggle its visibility.
Users press arrow keys to navigate between directors. The posters travel in the corresponding direction of the navigation. We had test users tell us that this was almost a game-like experience, which we were very happy to hear.
To make the experience delightful, playful and intuitive, I added minor interactive details to the user interface, such as the arrow key SVGs that animate when user presses up or down keys.
With each visualization, the user can choose to display the NYT articles on top of the visualization.
Each bubble contains a NYT article snippet, and user can hover on top of the bubble to increase its opacity. They can also navigate to the actual article by clicking on the "Read More", which brings them to the full article.
I wanted to provide a more efficient and comprehensive way to navigate in between directors, therefore I built another Catalog page where users can view all the directors in the gallery, and by clicking on the director name, they will be brought to that director's data visualization page. Users can view the Catalog in two sortings: number of movies and average box office.